So, to summarize:
You refuse to provide even a single peer-reviewed source and suggest that the peer review process is essentially meaningless and a massive global conspiracy while suggesting, of course, that you have "plenty that would show it". You just choose not to. Because there's no point because it's all politics anyway. Got it.
You continue to maintain that the Holocene maximum saw
global mean temps of 5C above present which is demonstrably false and can literally be disproved with a 3 second google search or any introductory climate science textbook. Got it.
You shamelessly dug up one of the John Christy's incredibly misleading and dishonest representations of models vs. temp (please see this analysis for the many reasons why even the words "cherry picked" don't do it justice:
https://www.theguardian.com/environ...orite-climate-chart-has-some-serious-problems )
Gavin Schmidt, Director of NASA's GISS posted a detailed commentary on it here as well:
http://www.realclimate.org/index.php/archives/2016/05/comparing-models-to-the-satellite-datasets/
Carbon Brief has done a great analysis of the many GCMs vs. observed global mean temps here:
https://www.carbonbrief.org/analysis-how-well-have-climate-models-projected-global-warming
This discussion is beginning to have a whiff of deliberate deception to it so I'll bow out and not waste any more time.
Ok, firstly, John Christy's chart comparing model projections to satellite data is factual & accurate. The Guardian, a left wing publication, exists to defame any & every scientist who disgarees with the climate crisis industry.
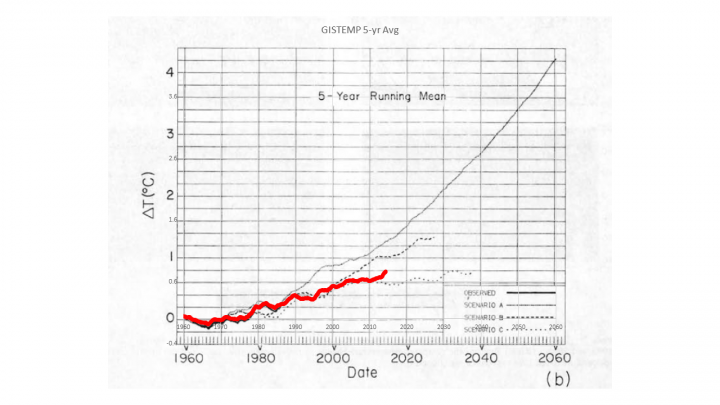
Another climate projection by Hanson, thirty years ago, also shows just how wrong the alarmist activist scientists have got it!
The satellite data, the most accurate we have, shows how little warming we have seen in the last 21 years -
just two tenths of 1 degree C, in 21 years, (and only because of the 2015/16 El) nino and you cannot prove that any of that is attributable to CO2!
Your other links are from real climate, a site created & maintained by pro climate change activists, whose corrupt actions were caught out by the revelation of the climate gate emails,
and Carbon Brief, another group of climate crisis industry activist zeolots.
The holocene
http://www.ldeo.columbia.edu/~blinsley/Dr._B._K_Linsley/Indonesia_&_Pacific_Intermediate_Water_files/Rosenthal.Linsley.Oppo 2013 Pac.Ocean.Heat.pdf
Pacific Ocean Heat Content During the Past 10,000 Years
Yair Rosenthal,1 * Braddock K. Linsley,2 Delia W. Oppo3
We show that water masses linked to North Pacific and Antarctic intermediate waters were warmer by 2.1 T 0.4°C and 1.5 T 0.4°C, respectively, during the middle Holocene Thermal Maximum than over the past century.
The inferred similarity in temperature anomalies at both hemispheres is consistent with recent evidence from Antarctica (30), thereby supporting the idea that the HTM, MWP, and LIA were global events.
https://en.wikipedia.org/wiki/Holocene_climatic_optimum
The
Holocene Climate Optimum warm event consisted of increases of up to 4 °C near the
North Pole (in one study, winter warming of 3 to 9 °C and summer of 2 to 6 °C in northern central
Siberia).
[1] Northwestern Europe experienced warming, but there was cooling in
Southern Europe.
[2] The average temperature change appears to have declined rapidly with latitude and so essentially no change in mean temperature is reported at low and middle latitudes.
http://www.dandebat.dk/eng-klima7.htm
The hottest time in the Holocene occurred in the Stone Age about 8,000 years before present, it is called the Holocene Maximum.
It is assumed that the average temperature was 2-3 degrees higher than today's. This is supported by the fact that plants such as mistletoe and the subtropical aquatic plant Trapa natans grew widespread in south Scandinavia.
most sources mention that Scandinavian Stone Age was about 2-3 degrees warmer than the present;
Some studies indicate that the sea surface temperature of the world's oceans was up to 5 degrees higher than today's surface temperature (Darby, 2001).
https://www.sciencedirect.com/science/article/pii/S0277379110003744
Holocene temperature variations at a high-altitude site in the Eastern Alps: a chironomid record from Schwarzsee ob Sölden, Austria
the most notable feature of the Holocene climate at SOS is a well-defined early-Holocene thermal maximum (HTM) between ca 10 000 and 8600 cal yr BP, when chironomid-inferred temperature was 7.0–8.5 °C, i.e. up to ca 4.5 °C warmer than at present
Watervapor feedback.
IPCC
8.6.2.3 What Explains the Current Spread in Models’ Climate Sensitivity Estimates?
In AOGCMs, the water vapour feedback constitutes by far the strongest feedback, with a multi-model mean and standard deviation for the MMD at PCMDI of 1.80 ± 0.18 W m–2 °C–1, followed by the (negative) lapse rate feedback.
Because the water vapour and temperature responses are tightly coupled in the troposphere (see Section 8.6.3.1), models with a larger (negative) lapse rate feedback also have a larger (positive) water vapour feedback.
So, what this means is, the stronger the hypothesised positive water vapor feedback is, the stronger the negative lapse rate feedback.
Positive water vapor feedback dictates that water vapor must increase specifically in the mid tropical troposphere. this results in a much faster rate of warming in the mid tropical troposphere than at the earths surface (negative lapse rate feedback).
RSS satellite data, collected since 1978, shows that the rate of warming is not faster in the tropical mid tropospher than it is at the surface.
Temperature trend Lower Tropospher is 0.150K/decade
Temperature trend Mid Tropospher is only 0.142K/decade
This is the opposite to model projections because mid tropospheric water vapor is not increasing.
UAH satellite data, also collected since 1978, also shows that the rate of warming is not faster in the tropical mid tropospher than it is at the surface.
Lower Troposphere:
http://vortex.nsstc.uah.edu/data/msu/v6.0/tlt/uahncdc_lt_6.0.txt
rate of warming in the tropical Lower Troposphere is 0.12 K/decade
Mid-Troposphere:
http://vortex.nsstc.uah.edu/data/msu/v6.0/tmt/uahncdc_mt_6.0.txt
rate of warming in the tropical Mid Troposphere is only 0.08 K/decade
Tyhis is the opposite of the promoted hypothesis, & the opposite of climate models.
Based on IPCC theory, the real world satellite data shows negative water vapor feedback, & this means net negative feedback to increasing co2, & this translates to an
equilibrium climate sensitivity to a doubling of co2 to be less thans co2's direct effect of a maximum of 1C for a doubling.
Climate crisis over.