"Letting coral reefs die will cost us more than saving them".

  • Thread starter Thread starter Dom
  • Start date Start date
  • Tagged users None
Twelve month boxcar smoothing is standard practice for removing high frequency changes. This is how every single global mean temp record is typically analyzed. No need to accuse me of manipulation. Even removing the smoothing, you just showed a graph with very clear and continued temperature rise proceeded by the statement "since then the temperature has plateaued... for 21 years". This is demonstrably false. You're continuing to make statements that aren't in any way backed up by the data. This is dishonest behavior.
You continue ignoring the fact that the IPCC does not contribute the rise in temperature from 1910 to the 1940s to human greenhouse emissions, & thus humans are not"behind the majority of the warming seen in the past century", what lying alarmist rubbish! What caused this warming> natural processes.
You continue ignoring the fact that the Earths temp has been rising, & glaciers melting, for at least 200 years > again, natural processes, not humans.
You ignore the fact the the Roman, & Medieval global warming periods were due to natural processes.
You ignore the fact that the data shows that the hypothesis of positive water vapor feedback is wrong, & thus, net feedback is not positive, & thus the models are way over sensitive to increases of co2 & this is resposible for the large discrepency between the forcast rate of warming & the observed rate of warming (as noted by the IPCC in their last report), & any warming, due to greenhouse gasses, predominently co2, will be mild & anything but detrimental.

You cite some imaginary "200+ national science academies on earth" endorsing the climate scare as proof something where no actual scientific evidence exists. Science does not work by concensus, especially by academies that make these statements without asking or polling their members. There are not 200 academies worldwide endorsing anything. Many of those academies who have endorsed the baseless climate scare have recieved a backlash from their members for making unfounded & unprovable statements.

While real polling of climate scientists and organization memberships is rare, there are a few examples.

A 2008 international survey of climate scientists conducted by German scientists Dennis Bray and Hans von Storch revealed deep disagreement regarding two-thirds of the 54 questions asked about their professional views. Responses to about half of those areas were skewed on the “skeptic” side, with no consensus to support any alarm. The majority did not believe that atmospheric models can deal with important influences of clouds, precipitation, atmospheric convection, ocean convection, or turbulence. Most also did not believe that climate models can predict precipitation, sea level rise, extreme weather events, or temperature values for the next 50 years.

A 2009 report issued by the Polish Academy of Sciences PAN Committee of Geological Sciences, a major scientific institution in the European Union, agrees that the purported climate consensus argument is becoming increasingly untenable. It says, in part, that: “Over the past 400 thousand years – even without human intervention – the level of CO2 in the air, based on the Antarctic ice cores, has already been similar four times, and even higher than the current value. At the end of the last ice age, within a time [interval] of a few hundred years, the average annual temperature changed over the globe several times. In total, it has gone up by almost 10 °C in the northern hemisphere, [and] therefore the changes mentioned above were incomparably more dramatic than the changes reported today.”

A March 2008 canvas of Canadian scientists with the Association of Professional Engineers, Geologists and Geophysics of Alberta (APEGGA) found that although 99% of 1,077 replies believe climate is changing, 68% disagreed with the statement that “…the debate on the scientific causes of recent climate change is settled.” Only 26% of them attributed global warming to “human activity like burning fossil fuels.” Regarding these results, APEGGA’s executive director, Neil Windsor, commented, “We’re not surprised at all. There is no clear consensus of scientists that we know of.”

A 2010 survey of media broadcast meteorologists conducted by the George Mason University Center for Climate Change Communication found that 63% of 571 who responded believe global warming is mostly caused by natural, not human, causes. Those polled included members of the American Meteorological Society (AMS) and the National Weather Association.

A more recent 2012 survey published by the AMS found that only one in four respondents agreed with UN Intergovernmental Panel on Climate Change claims that humans are primarily responsible for recent warming. And while 89% believe that global warming is occurring, only 30% said they were very worried.

Since 1998, more than 31,000 American scientists from diverse climate-related disciplines, including more than 9,000 with Ph.D.s, have signed a public petition announcing their belief that “…there is no convincing scientific evidence that human release of carbon dioxide, methane, or other greenhouse gases is causing or will, in the foreseeable future, cause catastrophic heating of the Earth’s atmosphere and disruption of the Earth’s climate.” Included are atmospheric physicists, botanists, geologists, oceanographers, and meteorologists.

Senator James Inhofe, Ranking Member of the Senate Committee on Environment and Public Works has observed: “The notion of a ‘consensus’ is carefully manufactured for political and ideological purposes. While it may appear to the casual observer that scientists promoting climate fears are in the majority, the evidence continues to reveal that this is an illusion.”

In 2007, Congress appropriated $5,856,000 for NAS to complete a climate change study. The organization subsequently sold its conclusions in three separate report sections at $44 per download.
What scientific understanding breakthrough did that big taxpayer-financed budget buy? Namely that the Earth’s temperature has risen over the past 100 years, and that human activities have resulted in a steady atmospheric CO2 increase. All professional scientists recognize that correlation does not establish causation.

In 2009, eighty prominent scientists, researchers and environmental business leaders, including many physicists, asked the century-old American Physical Society (APS), the nation’s leading physics organization, to change its policy statement which contains such language as “Emissions of greenhouse gases from human activities are changing the atmosphere in ways that affect the Earth’s climate”, and “The evidence is incontrovertible: Global warming is occurring.”

Instead, the group of scientists and academic leaders urged APS to revise its statement to read:

As physicists who are familiar with the science issues, and as current and past members of the American Physical Society, we the undersigned urge the Council to revise its current statement* on climate change as follows, so as to more accurately represent the current state of the science:

Greenhouse gas emissions, such as carbon dioxide, methane, and nitrous oxide, accompany human industrial and agricultural activity. While substantial concern has been expressed that emissions may cause significant climate change, measured or reconstructed temperature records indicate that 20th and 21st century changes are neither exceptional nor persistent, and the historical and geological records show many periods warmer than today. In addition, there is an extensive scientific literature that examines beneficial effects of increased levels of carbon dioxide for both plants and animals.

Studies of a variety of natural processes, including ocean cycles and solar variability, indicate that they can account for variations in the Earth’s climate on the time scale of decades and centuries. Current climate models appear insufficiently reliable to properly account for natural and anthropogenic contributions to past climate change, much less project future climate.

The APS supports an objective scientific effort to understand the effects of all processes—natural and human—on the Earth’s climate and the biosphere’s response to climate change, and promotes technological options for meeting challenges of future climate changes, regardless of cause.

Signatories:

Harold M. Agnew
Director, Los Alamos National Laboratory (1970-1979)
President, General Atomics Corporation (1979-1984)
White House Science Councilor (1982-1989)
E.O. Lawrence Award 1966, Enrico Fermi Award 1978, Los Alamos Medal (with H.A. Bethe) 2001 Member National Academy of Sciences, National Academy of Engineering, Fellow APS, AAAS

Sol Aisenberg
President, International Technology Group
Formerly Staff Member, MIT; Lecturer, Harvard Medical School;
Visiting Research Professor, Boston University

Ralph B. Alexander
Former Associate Professor of Physics, Wayne State University
President, R.B. Alexander & Associates
Author, Global Warming False Alarm (Canterbury)

Moorad Alexanian
Professor of Physics and Physical Oceanography, University of North Carolina Wilmington
Member Mexican Academy of Sciences

Louis J. Allamandola
Director, Astrochemistry Laboratory
NASA Ames Research Center
Fellow APS, AAAS
Member ACS, American Astronomical Society, International Astronomical Union

Eva Andrei
Professor of Physics, Rutgers University
Fellow APS

Robert H. Austin
Professor of Physics, Princeton University
Fellow APS, AAAS; APS Council: 1991-1994, 2007-2010
Member National Academy of Sciences, American Association of Arts and Sciences

Franco Battaglia
Professor of Chemical Physics and Environmental Chemistry, University of Modena, Italy
Life Member APS

David J. Benard
Aerospace Scientist (retired)
Coinventor of the Chemical OxygenIodine Laser

Lev I. Berger
President, California Institute of Electronics and Materials Science
Author, Semiconductor Materials and
Material and Device Characterization Measurements (CRC Press)

Stuart B. Berger
Research Fellow, Xerox Corporation (retired)

Ami E. Berkowitz
Emeritus Professor of Physics, University of California at San Diego
Fellow APS

Barry L. Berman
Columbian Professor and Chair, Physics Department, The George Washington University
Fellow APS

Edwin X. Berry
Atmospheric Physicist, Climate Physics, LLC
Certified Consulting Meteorologist #180
Member American Meteorological Society

Vladislav A. Bevc
Associate Professor, Naval Postgraduate School, Monterey (retired);
Formerly Technical Staff Member, The Aerospace Corporation;
Physicist, Lawrence Livermore National Laboratory;
Visiting Fellow, Hoover Institution (Stanford University)
Member IEEE

Clifford Bruce Bigham
Atomic Energy of Canada, Ltd. (retired)
Senior Member APS, Sustaining Member CAP

Arie Bodek
George E. Pake Professor of Physics, University of Rochester
Wolfgang K. H. Panofsky Prize in Experimental Particle Physics (APS) 2004
Fellow APS

Lowell S. Brown
Emeritus Professor of Physics, University of Washington
Scientific Staff Member, Los Alamos National Laboratory
Fellow APS, AAAS

Daniel M. Bubb
Associate Professor and Chair, Department of Physics, Rutgers University-Camden

Timothy D. Calvin
President, Bearfoot Corporation (retired)
Member ACS

Gregory H. Canavan
Senior Fellow and Scientific Advisor, Los Alamos National Laboratory
Fellow APS

Roger W. Cohen
Manager, Strategic Planning and Programs, ExxonMobil Corporation (retired)
Otto Schade Prize (Society for Information Display) 2006
Fellow APS

Steven R. Cranmer
Astrophysicist, HarvardSmithsonian Center for Astrophysics
Karen Harvey Prize (AAS) 2006
Associate Editor, Journal of Geophysical Research: Space Physics
Member: American Astronomical Society, American Geophysical Union

Jerry M. Cuttler
President, Cuttler and Associates, Inc.
President, Canadian Nuclear Society 19951996
Fellow Canadian Nuclear Society
Member American Nuclear Society

Joseph G. Depp
Founding President and CEO, Accuray Incorporated (retired)
Founding President and CEO, PsiStar Incorporated
Life Member APS

Riccardo DeSalvo
Senior Scientist Laser Interferometer Gravitational Wave Observatory (LIGO)
California Institute of Technology
Member ASME

David H. Douglass
Professor of Physics, University of Rochester
Fellow APS

Paul J. Drallos
President and CEO, Plasma Dynamics Corporation (retired)

William T. Duffy Jr.
Professor Emeritus of Physics, Santa Clara University

David F. Edwards
Physicist, Lawrence Livermore National Laboratory (retired)
Formerly Los Alamos National Laboratory
Professor of Physics and Electrical Engineering, Colorado State University
Lincoln Laboratory, MIT

Albert G. Engelhardt
President and CEO, Enfitek, Inc.
Senior Life Member IEEE

Hughen Falconer
Emeritus Professor of Geology, University of Aberdeen
Member American Geophysical Union

Jens G. Feder
Professor of Physics of Geological Processes, University of Oslo
Fellow APS

Peter D. Friedman
Associate Professor of Mechanical Engineering, University of Massachusetts Dartmouth
Member American Geophysical Union, ASME, American Nuclear Society

Rodger L. Gamblin
Inventor, holder of 44 U.S. patents

G. Roger Gathers
Senior Scientist, M. H. Chew and Associates
Physicist, Lawrence Livermore National Laboratory (1967-1993)
Author, Selected Topics in Shock Wave Physics and Equation of State Modeling (World Scientific Publishing)

Gary J. Gerardi
Professor, Department of Chemistry and Physics, William Paterson University

Ivar Giaever
Institute Professor, School of Engineering and School of Science, Rensselaer Polytechnic Institute
Nobel Prize in Physics 1973
Fellow APS, Member National Academy of Science, National Academy of Engineering

Albert Gold
Associate Dean of Engineering and Applied Sciences (Retired), Harvard University

Laurence I. Gould
Professor of Physics, University of Hartford
Member Executive Board of the New England Section of the APS
Chairman (2004), New England Section APS

Paul M. Grant
EPRI Science Fellow (retired)
IBM Research Staff Member Emeritus
Senior Life Fellow APS

Howard D. Greyber
University of Pennsylvania (retired)
Formerly Princeton University, LLNL Theory Group, Northeastern University
Member American Astronomical Society, Fellow Royal Astronomical Society

Mike Gruntman
Professor of Astronautics, University of Southern California
Author, Blazing the Trail. The Early History of Spacecraft and Rocketry (AIAA)
Luigi G. Napolitano Book Award (International Academy of Astronautics) 2006
Member American Geophysical Union, Associate Fellow AIAA

George Hacken
Senior Director, SafetyCritical Systems, New York City Transit Authority
Formerly Senior Member of the Technical Staff, GECMarconi Aerospace
Chair, New York Chapter, IEEE Computer Society
Member AMS, SIAM, ANS, AIAA, New York Academy of Sciences

Sultan Hameed
Professor of Atmospheric Science, School of Marine and Atmospheric Sciences
Stony Brook University, New York

William Happer
Cyrus Fogg Brackett Professor of Physics, Princeton University
Fellow APS, AAAS
Member National Academy of Sciences

Howard C. Hayden
Emeritus Professor of Physics, University of Connecticut
Editor, The Energy Advocate
Author, A Primer on CO2 and Climate (Vales Lake)

Jack M. Hollander
Professor Emeritus of Energy and Resources, University of California, Berkeley
Vice President Emeritus, The Ohio State University
First Head, Energy and Environment Division, Lawrence Berkeley Laboratory
Fellow APS, AAAS

David B. Holtkamp
Scientific Staff Member, Physics Division, Los Alamos National Laboratory

Helen Jackson
Physicist, U.S. Air Force, Wright Patterson Air Force Base
Member Materials Research Society, IEEE

James R. Johnson
3M Company (retired)
Member Carlton Society (3M Hall of Fame)
Member National Academy of Engineering

O’Dean Judd
LANL Fellow, Los Alamos National Laboratory (retired)
Technical Advisor and Consultant
Fellow APS, IEEE, AAAS

Andrew Kaldor
Distinguished Scientific Advisor, Manager of Breakthrough Research, ExxonMobil Corporation (retired)
Fellow AAAS, Member ACS

Alexander E. Kaplan
Professor, Department of Electrical and Computer Engineering, The Johns Hopkins University
Max Born Award (Optical Society of America) 2005
Alexander von Humboldt Award (von Humboldt Foundation) 1996. Fellow OSA

Jonathan Katz
Professor of Physics, Washington University

William E. Keller
Leader. Low Temperature Physics Group 1971-1985, Los Alamos National Laboratory (retired)
Fellow APS

John M. Kennel
Autonetics Division, Boeing North American (retired)
Formerly Electronics Division, Northrop Grumman Corporation
Member AAAS, AIAA

Robert S. Knox
Professor of Physics Emeritus, University of Rochester
Member APS Council (1985-1988)
Fellow APS

Joseph A. Kunc
Professor, Physics and Astronomy, University of Southern California
Fellow APS

Robert E. LeLevier
Lawrence Livermore National Laboratory (1951-1957)
Physics Department, RAND Corp (1957-1971)
R&D Associates (1971-1983)
Eos Technologies, Inc. (1983-1993)

Robert E. Levine
Industrial and Defense Physics and Engineering (retired)
Member ACM, IEEE

John D. Lindl
James Clerk Maxwell Prize for Plasma Physics (APS) 2007
Fellow APS, AAAS

Michael D. Lubin
Colonel, United States Air Force (retired)

Alfred U. MacRae
President, MacRae Technologies
Fellow APS, IEEE, Member National Academy of Engineering

Phillip W. Mange
Associate Superintendent, Space Science Division
Scientific Consultant to the Director of Research,
Naval Research Laboratory (retired)

Joseph Maserjian
Senior Research Scientist, California Institute of Technology Jet Propulsion Laboratory (retired)

Harold Mirels
Principal Scientist, The Aerospace Corporation (retired)
Fellow APS, AIAA
Member National Academy of Engineering

Jim Mitroy
Lecturer in Physics, School of Engineering and Information Technology, Charles Darwin University, Australia

Michael Monce
Professor of Physics, Astronomy, and Geophysics, Connecticut College
Member AAPT, American Geophysical Union

Nasif Nahle
Scientific Research Director
Biology Cabinet, Mexico
Member AAAS, New York Academy of Sciences

Rodney W. Nichols
President and CEO, New York Academy of Sciences (1992-2001)
Vice President and Executive Vice President, The Rockefeller University (1970-1990)
Secretary of Defense Medal for Distinguished Meritorious Civilian Service (1970)
Fellow AAAS, New York Academy of Sciences

Gordon C. Oehler
Senior Fellow, Potomac Institute for Policy Studies
Working Group Chairman, Congressional Commission on the Strategic Posture of the United States.
Corporate Vice President for Corporate Development, SAIC (1998-2004)
National Intelligence Officer for Science, Technology and Proliferation (1989-1992)

William P. Oliver
Professor of Physics, Tufts University
Life Member APS

Frank R. Paolini
Adjunct Professor of Physics, University of Connecticut at Stamford (retired)
Senior Member APS, Member IEEE

Thomas E. Phipps, Jr.
Physicist (retired)
Operations Evaluation Group, MIT
US Naval Ordnance Laboratory
Senior Member APS

Donald Rapp
Chief Technologist, Mechanical and Chemical Systems, Jet Propulsion Laboratory (retired)
Professor of Physics and Environmental Engineering, University of Texas (1973-1979)
Author, Assessing Climate Change and Ice Ages and Interglacials (SpringerVerlag)
Fellow APS

Ned S. Rasor
Consulting Physicist
Formerly President and CEO, Rasor Associates, Inc.
Member IEEE, AIAA

John E. Rhoads
Professor of Physics, Midwestern State University (retired)
Member SPE

Harry I. Ringermacher
Sr. Research Physicist, General Electric Global Research Center
AIP “History of Physics in Industry” Participant at GE
Sir William Herschel Medal (American Academy of Thermology)
Copper Black Award (American Mensa) 2003 and 2007

Stanley Robertson
Emeritus Professor of Physics, Southwestern Oklahoma State University

Berol Robinson
Principal Scientific Officer, UNESCO (retired)
Member AAPT, AAAS, Association des Écologistes Pour le Nucléaire

Raymond E. Sarwinski
President, Cryogenic Designs, Inc.
Life Member APS

Nicola Scafetta
Research Scientist, Physics Department, Duke University
Member American Geophysical Union

Thomas P. Sheahen
President/CEO, Western Technology, Inc.
Member AAAS; APS Congressional Science Fellowship (1977-1978)
Author, Introduction to High Temperature Superconductivity (Springer)

Joseph Silverman
Professor Emeritus of Nuclear Engineering, Department of Materials Science and Engineering, University of Maryland
Fellow APS, ANS

S. Fred Singer
Professor of Environmental Sciences Emeritus, University of Virginia
First Director of the National Weather Satellite Service
Fellow APS, AAAS, American Geophysical Union

Hermann Statz
Raytheon Corporation (retired)
Microwave Pioneer Award (IEEE) 2004
Fellow APS

Nick Steph
Chair, Department of Physics, Franklin College
Member AAPT, ACS

Peter Stilbs
Professor of Physical Chemistry Royal Institute of Technology (KTH), Stockholm, Sweden
Life Member APS

Szymon Suckewer
Professor, School of Engineering & Applied Sciences, Director of Plasma Science and Technology Program, Princeton University
Fellow APS, OSA

Ronald M. Sundelin
Associate Director, DOE Thomas Jefferson National Accelerator Facility (retired) Commonwealth Professor Emeritus of Physics, Virginia Tech
Fellow APS

Frank J. Tipler
Professor of Mathematical Physics, Tulane University
Coauthor, The Anthropic Cosmological Principle (Oxford University Press)

Salvatore Torquato
Professor of Chemistry,Princeton Center for Theoretical Science
2009 APS David Alder Lectureship Award in the Field of Material Physics
Fellow APS

Edward S. Troy
Principal Engineer Aerospace Consulting Wireless, RF, microwave, analog/DSP, and GPS circuits and systems
Member IEEE

Samuel A. Werner
Curators’ Professor Emeritus, The University of Missouri
Guest Researcher, NIST Fellow APS, AAAS

Bruce J. West
Adjunct Professor of Physics, Duke University
Fellow APS

Peter J. Wojtowicz
Group Head, Senior Member Technical Staff (retired), RCA Labs, GE, Sarnoff Corporation Fellow APS

YaHong Xie
Professor of Materials Science and Engineering, University of California at Los Angeles
Senior Member IEEE, Member Materials Research Society

M. John Yoder
Principal Physicist, The MITRE Corporation
Life Member APS

Martin V. Zombeck
Physicist, HarvardSmithsonian Center for Astrophysics (retired)
Author, Handbook of Space Astronomy and Astrophysics (Cambridge University Press)
Coauthor, High Resolution XRay Spectroscopy of Cosmic Plasmas (Cambridge University Press)

 
Hey, I get it. I hate science too.
No, no, that was alarmism, not science. Just like the present climate crisis is built on alarmism, & lies!

Here's some proper science -

upload_2018-6-27_13-2-41.png


The red curve shows global emissions of carbon dioxide from burning of fossil fuels.
You can see that global sea levels were rising steadily long before fossil fuels emissions became substantial.
You can also see that the steep increase in emissions following 1950 is associated with very little sea level rise between 1950 and 1990.

An uptick in sea level rise occurred in the 1990’s, which is circled.

What is causing recent sea level rise?

Since 1993, global satellite data have provided valuable information about sea level variations and glacier mass balance.

This figure shows a recent analysis of the budget of sea level rise since 1993. You can see that overall the rate of sea level rise has increased since 1993.

upload_2018-6-27_13-3-6.png

https://curryja.files.wordpress.com/2018/06/slide101.png
What is causing this increase?

The turquoise region on the bottom of the diagram relates directly to expansion from warming.
You actually see a decrease until about 2009, which has been attributed to the cooling impact following the eruption of Mount Pinatubo in 1992.

What stands out as causing the increase in the rate of sea level rise is the growing contribution from Greenland, which is the dark blue area on top.

Hence the recent increase in the rate of sea level rise is caused by >>>>>Greenland melting. <<<<< :eek:


So, is the Greenland melting caused by increasing CO2 emissions?

The figure below shows the Greenland mass balance for the 20th century.
Ice sheet mass balance is defined as increase from snowfall, minus the decrease from melting.
You can see the negative mass balance values after 1995, reflecting mass loss that raises sea level.

If you look earlier in the record, you see even larger negative values particularly in the 1920’s and 1930’s.
Clearly, the high surface mass loss rates of recent years are not unprecedented, even in the 20thcentury.

upload_2018-6-27_13-3-47.png


Greenland was anomalously warm in the 1930’s and 1940’s. What caused this?

The bottom figure shows variations in the Atlantic Multidecadal Oscillation, which is an important mode of natural internal climate variability. The AMO is a powerful control on the climate of Greenland.

In general, years with positive AMO index are associated with a mass loss for Greenland, whereas negative AMO index is associated with a mass gain.

https://judithcurry.com/2018/06/12/the-debate-mann-titley-moore-curry/#more-24162
 
I would imagine if the NYPost was around a 100,000 years ago....btwn ice glaciers forming and volcanoes blowing up all around the world....they'd sell more newspapers on DOOM n GLOOM.

What about wildfires 1000yrs ago probably wiping out all trees over half the USA territory with NO ONE to stop the wildfires. Ohhhh my :/ I think we survived that stuff

Earth continues to change and flex over millions of years....once we collectively blow humankind off the face of this planet, I'm sure God-The-Creator will heal the Earth
 
Last edited:
No, no, that was alarmism, not science. Just like the present climate crisis is built on alarmism, & lies!

Here's some proper science -

upload_2018-6-27_13-2-41.png


The red curve shows global emissions of carbon dioxide from burning of fossil fuels.
You can see that global sea levels were rising steadily long before fossil fuels emissions became substantial.
You can also see that the steep increase in emissions following 1950 is associated with very little sea level rise between 1950 and 1990.
24162

Scientists change their theories when new data is presented. You are not.
 
You continue ignoring the fact that the IPCC does not contribute the rise in temperature from 1910 to the 1940s to human greenhouse emissions, & thus humans are not"behind the majority of the warming seen in the past century", what lying alarmist rubbish! What caused this warming> natural processes.
You continue ignoring the fact that the Earths temp has been rising, & glaciers melting, for at least 200 years > again, natural processes, not humans.
You ignore the fact the the Roman, & Medieval global warming periods were due to natural processes.
You ignore the fact that the data shows that the hypothesis of positive water vapor feedback is wrong, & thus, net feedback is not positive, & thus the models are way over sensitive to increases of co2 & this is resposible for the large discrepency between the forcast rate of warming & the observed rate of warming (as noted by the IPCC in their last report), & any warming, due to greenhouse gasses, predominently co2, will be mild & anything but detrimental.

IPCC AR5 specifically looks at warming since 1950 and attributes 100% from 1950 to the present to anthropogenic forcing. It makes no claim, as you erroneously suggest, about what percentage of warming between 1910 and 1940 was anthropogenic vs. natural (from my understanding that period was likely a combination of both). But for the sake of argument, let's assume 0% of the warming between 1910-1940 was anthropogenic. and 100% of warming since 1950 was (as IPCC AR5 posits) Since the earth warmed at a rate of [1.38C/Century (NOAA)] during the 30 years between 1910 and 1940 and [1.87C/Century (NOAA)] during the 30 years between 1975 and 2005 and has continued to warm since, the claim that "humans are behind the majority of the warming in the past century" holds true according to my best recollection of elementary school arithmetic. Again, this assumes none of the warming prior to 1950 can be attributed to anthropogenic forcing which is almost certainly not true since human beings have been altering the carbon cycle on some level since roughly 1750 -- and making changes to the landscape worldwide since the dawn of the Holocene.

The Roman and Medieval warming periods were localized warming limited to certain regions with cooling seen in others, not net warming of the system as a whole. This is literally one of the first things a person learns in an intro climate science class.

The data does not conclusively show any such thing about water vapor. There is a good deal of uncertainty about water vapor feedbacks.


You cite some imaginary "200+ national science academies on earth" endorsing the climate scare as proof something where no actual scientific evidence exists. Science does not work by concensus, especially by academies that make these statements without asking or polling their members. There are not 200 academies worldwide endorsing anything. Many of those academies who have endorsed the baseless climate scare have recieved a backlash from their members for making unfounded & unprovable statements.

...

http://www.opr.ca.gov/facts/list-of-scientific-organizations.html

As for that enormous list of what appear to be random not-climate-scientists endorsing the skeptic position... not really sure what to say. I'll stick with what the vast majority of people who actually have expertise in the field have to say, thanks. Seems like the pragmatic thing to do since I'm young enough to have to risk living with the consequences if your conspiracy theory turns out to be unfounded.

At this point, since you seem to basically just be going down the bullet point list of endlessly-refuted denier talking points from the various conspiracy theory blogs, I'll just get to the meat and potatoes of this thing:

What evidence would change your mind?
 
Scientists change their theories when new data is presented. You are not.
A lot of talking and blaming going on here coupled with overly simplistic interpretation of data. There is nothing that should make us believe that any climate change, regardless of the cause or direction of the thermometer, would occur in a linear fashion or be explainable by univariate contributions. People tend to force things into a form which is digestible to them, even if that isn't realistic or causes all the substance to be lost. People also like to make things binary, and force us on one side or the other. Fact is, we need different theories and analysis, and we need to discuss and rediscuss them until we reach the point of concensus. The scientific method doesn't have a horse in the race, but individuals always have their biases. Last thing you should do is listen to one voice or adopt another's position or stance. Unlike politics and the human world, the natural world is not a team sport with two sides, everyone is on the same team like it or not.
 
greenmonk-pic.jpg


What evidence would change your mind?

According to science, probably nothing. When a belief is held, especially if that belief is tied to a person's central idea of who they are and how the world works (i.e. I'm in this political group and we believe this) if they are presented with information that disputes that belief they rarely change their minds. Indeed, they usually double down on said believe as a defense mechanism against cognitive dissonance.

https://www.npr.org/templates/story/story.php?storyId=128490874

3.png
 
Last edited:
As usual, everyone is trying to convince everyone else that their view is correct when the likelihood is that no one is. And yes, way to expensive to save the earth...……….. so lets not even bother to try.
 
As usual, everyone is trying to convince everyone else that their view is correct when the likelihood is that no one is. And yes, way to expensive to save the earth...……….. so lets not even bother to try.

This isn't one of those things. Either the climate is warming, or it isn't. And either we are contributing to that, or we aren't. Most deniers will now admit that the climate is indeed warming, although it took them a long time to get there. Now the goalpost has moved to "we aren't contributing to it".

Fortunately it is actually becoming less of a problem. Wind power is now cost comparable (before subsidies) to fossil fuel power, and solar is about there too. That isn't even factoring in the huge cost of a major war every few years to keep global oil supplies stable and the other negative externalities of pollution (public health etc.) The deniers can cling all they want but the world is moving in the right direction.
 
LOL

Burn the heretics.

That isn't what science sounds like.
 
The Roman and Medieval warming periods were localized warming limited to certain regions with cooling seen in others, not net warming of the system as a whole. This is literally one of the first things a person learns in an intro climate science class.
You must have gone to Alarmism High

Evidence that the Medieval Warm Period was global

Africa http://www.co2science.org/data/mwp/regions/africa.php

Archaeological evidence for climatic change during the last 2000 years in southern Africa
Abstract
Another wet period from about AD 900 to 1290—the Medieval Warm Epoch—permitted the build-up of large populations at K2 and Mapungubwe. The abandonment of Mapungubwe and simultaneous rise of Great Zimbabwe coincided with the beginning of the dry Little Ice Age
https://www.sciencedirect.com/science/article/pii/104061829500095X

The Little Ice Age and medieval warming in South Africa
Abstract
The Little Ice Age in South Africa, from around AD 1300 to 1800, and medieval warming, from before 1000 to around 1300, are shown to be distinctive features of the regional climate of the last millennium.
The climate of the interior of South Africa was around 1°C cooler in the Little Ice Age and may have been over 3°C higher than at present during the extremes of the medieval warm period.
https://www.researchgate.net/public..._Ice_Age_and_medieval_warming_in_South_Africa


Antarctica http://www.co2science.org/data/mwp/regions/antarctica.php

Reduced ice extent on the western Antarctic Peninsula at 700–970 cal. years Before Present B.P. (the Medieval Warm Epoch)
Abstract
Rapid warming and consequent ice-shelf collapse have focused attention on the glacial record of the Antarctic Peninsula. Here, we present the first record of terrestrial organic material exposed by recently retreating ice that bears on past glacier extent and climate in this sensitive region. Radiocarbon dates show that ice on Anvers Island was at or behind its present position at 700–970 cal. yr B.P., coincident with ice reduction elsewhere in the Southern Hemisphere. Moreover, the data indicate that present reduced ice extent on the western Antarctic Peninsula is not unprecedented and is similar to that experienced during at least three periods in the last 5600 yr.
https://pubs.geoscienceworld.org/gs...the-western-antarctic?redirectedFrom=fulltext

Sediment core from beneath the Amery Ice Shelf, East Antarctica, suggests mid-Holocene ice-shelf retreat
Abstract
An increase in sea-ice–associated diatom deposition in the upper part of the Holocene suggests that a major retreat of the Amery Ice Shelf to at least 80 km landward of its present location may have occurred during the mid-Holocene climatic optimum.
https://pubs.geoscienceworld.org/gs...h-the-amery-ice-shelf?redirectedFrom=fulltext


Asia http://www.co2science.org/data/mwp/regions/asia.php

A modern pollen–temperature calibration data set from Korea and quantitative temperature reconstructions for the Holocene
Anomalies calculated from reconstructed paleo temperature data were combined to generate a synthesis temperature reconstruction for the east coast of Korea, in which the ‘Medieval Warm Period’, ‘Little Ice Age’, and ‘Migration Period’ were clearly shown.
http://journals.sagepub.com/doi/abs/10.1177/0959683611400462?journalCode=hola

Winter half-year temperature reconstruction for the middle and lower reaches of the Yellow River and Yangtze River, China, during the past 2000 years
Abstract
Then, abruptly, temperature entered a warm epoch from the ad 570s to 1310s (the Medieval Warm Epoch) with a warming trend of 0.04°C per century; the peak warming was about 0.3–0.6°C higher than present for 30-year periods, but over 0.9°C warmer on a 10-year basis.
http://journals.sagepub.com/doi/10.1191/0959683603hl680rr

Clarifying springtime temperature reconstructions of the medieval period by gap-filling the cherry blossom phenological data series at Kyoto, Japan
Abstract
The reconstructed tenth century March mean temperatures were around 7°C, indicating warmer conditions than at present. Temperatures then fell until the 1180s, recovered gradually until the 1310s, and then declined again in the mid-fourteenth century.
https://link.springer.com/article/10.1007/s00484-009-0272-x


Russia

Environmental changes in the northern Altai during the last millennium documented in Lake Teletskoye pollen record
Abstract
Around AD 1200 (the Medieval Warm Epoch), regional climate became warmer and more humid than present, as revealed by an increase of Siberian pine and decreases of dry herb taxa and charcoal contents.

upload_2018-6-28_9-1-7.png


Greenland – Arctic

Past Temperatures Directly from the Greenland Ice Sheet
Abstract
A Monte Carlo inverse method has been used on the temperature profiles measured down through the Greenland Ice Core Project (GRIP) borehole, at the summit of the Greenland Ice Sheet, and the Dye 3 borehole 865 kilometres farther south. The result is a 50,000-year-long temperature history at GRIP and a 7000-year history at Dye 3.

the Last Glacial Maximum, –23 kelvin (below present)

the Climatic (Holocene) Optimum, +2.5 kelvin (above present)

the Medieval Warmth, +1 kelvin (above present)

the Little Ice Age, –1 kelvin (below present)

and a warm period at 1930 A.D. +0.5 kelvin (above present)

http://science.sciencemag.org/content/282/5387/268


New Zealand

Short-term climate change and New Zealand temperatures during the last millennium

Temperatures derived from an 18O/16O profile through a stalagmite found in a New Zealand cave (40.67°S, 172.43°E) revealed the Medieval Warm Period to have occurred between AD 1050 and 1400 and to have been 0.75°C warmer than the Current Warm Period.
The temperature curve for New Zealand is apparently broadly similar to England and such climatic fluctuations, such as the Mediaeval Warm Period and Little Ice Age are not just local European phenomenon.
http://www.academia.edu/24699114/Sh...aland_temperatures_during_the_last_millennium


North America http://www.co2science.org/data/mwp/regions/northamerica.php

RECONSTRUCTION OF MILLENNIAL FOREST DYNAMICS FROM TREE REMAINS IN A SUBARCTIC TREE LINE PEATLAND
Abstract
Fast growth between AD 860–1000, along with the concurrent establishment of symmetrical trees, suggests well‐defined boundaries for the Medieval Warm Period in northeaster Canada.
https://esajournals.onlinelibrary.wiley.com/doi/abs/10.1890/0012-9658(1997)078[1873:ROMFDF]2.0.CO;2


South America http://www.co2science.org/data/mwp/regions/southamerica.php

Generation, transport, and preservation of the alkenone-based UK0 37 sea surface temperature index in the water column and sediments of the Cariaco Basin (Venezuela)
The highest UK0 37 -derived SST estimates (over 26.5C) were measured during the Medieval Warm Period (MWP) and suggest reduced upwelling at this time. Prior to the MWP, the alkenone record indicates temperatures of 26C and burial fluxes of 2 mg m2 d1 . These compositions indicate stronger upwelling conditions during the Holocene relative to the last 50 years and the MWP but annual SSTs above those estimated for the Little Ice Age.

upload_2018-6-28_9-5-57.png


http://scholarcommons.usf.edu/cgi/viewcontent.cgi?article=1058&context=msc_facpub

Late Holocene sea-surface temperature and precipitation variability in northern Patagonia, Chile
Abstract
We observed two different regimes of climate variability in our record: a relatively dry/warm period before 900 cal yr BP (the Medieval Warm Epoch) - lower runoff and average SST 1°C warmer than present day and a wet/cold period after 750 cal yr BP (Little Ice Age) - higher runoff and average SST 1°C colder than present day.
https://www.sciencedirect.com/science/article/pii/S0033589409000775


Northern Hemisphere

Highly variable Northern Hemisphere temperatures reconstructed from low- and high-resolution proxy data
Abstract
According to our reconstruction, high temperatures—similar to those observed in the twentieth century before 1990—occurred around AD 1000 to 1100 (the Medieval Warm Epoch) , and minimum temperatures that are about 0.7 K below the average of 1961–90 occurred around AD 1600 (Little ice age).
This large natural variability in the past suggests an important role of natural multicentennial variability that is likely to continue.

upload_2018-6-28_9-9-19.png


https://www.nature.com/articles/nature03265


Oceans http://www.co2science.org/data/mwp/regions/oceans.php


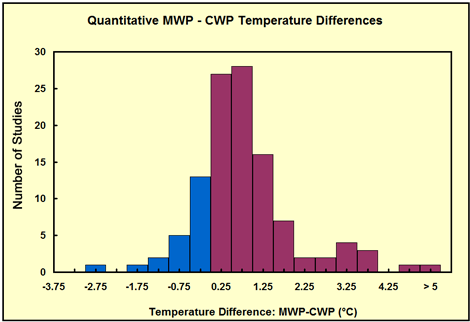
mwpquantitative.gif


Figure Description: The distribution, in 0.5°C increments, of Level 1 Studies that allow one to identify the degree by which peak Medieval Warm Period temperatures either exceeded (positive values, red) or fell short of (negative values, blue) peak Current Warm Period temperatures.


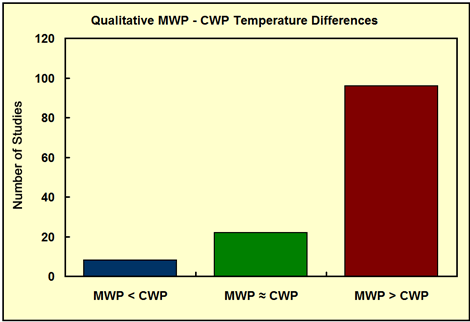
mwpqualitative.gif


Figure Description: The distribution of Level 2 Studies that allow one to determine whether peak Medieval Warm Period temperatures were warmer than (red), equivalent to (green), or cooler than (blue), peak Current Warm Period temperatures.
 
As for that enormous list of what appear to be random not-climate-scientists endorsing the skeptic position... not really sure what to say.
Yes, not supprised your lost for words here.

FYI, there is no such official job description as "climate scientist"!
But there are many fields of science that do research that falls into the broad catagory of climate related studies.
That list i provided is of scientists that fit that description.

But more importantly they are members of one of those science academies you speak of that you say endorse the alarmist position, the American Physical Society.
The APS board may have considered endorsing the alarmist position to be advantageous, but their endorsement wasn't representative of the opinions of their members - the scientists that make up its membership.
They were not polled for their opinion, & had zero input to the official statement their board of directors published.

This is the opinion of the scientist members of the APS position on the issue -

As physicists who are familiar with the science issues, and as current and past members of the American Physical Society, we the undersigned urge the Council to revise its current statement* on climate change as follows, so as to more accurately represent the current state of the science:

Greenhouse gas emissions, such as carbon dioxide, methane, and nitrous oxide, accompany human industrial and agricultural activity. While substantial concern has been expressed that emissions may cause significant climate change, measured or reconstructed temperature records indicate that 20th and 21st century changes are neither exceptional nor persistent, and the historical and geological records show many periods warmer than today. In addition, there is an extensive scientific literature that examines beneficial effects of increased levels of carbon dioxide for both plants and animals.

Studies of a variety of natural processes, including ocean cycles and solar variability, indicate that they can account for variations in the Earth’s climate on the time scale of decades and centuries. Current climate models appear insufficiently reliable to properly account for natural and anthropogenic contributions to past climate change, much less project future climate.

The APS supports an objective scientific effort to understand the effects of all processes—natural and human—on the Earth’s climate and the biosphere’s response to climate change, and promotes technological options for meeting challenges of future climate changes, regardless of cause.
 
IPCC AR5 specifically looks at warming since 1950 and attributes 100% from 1950 to the present to anthropogenic forcing.
LOL
What does the IPCC actually say?

"It is extremely likely that more than half of the observed increase in global average surface temperature from 1951 to 2010 was caused by the anthropogenic increase in GHG concentrations and other anthropogenic forcings together." IPCC

That doesn't say 100% at all. Stop making things up.

It makes no claim, as you erroneously suggest, about what percentage of warming between 1910 and 1940 was anthropogenic vs. natural (from my understanding that period was likely a combination of both).

My"suggestion" is accurate. The IPCC make no claims in that statement that any warming prior to >>> 1951 <<< was the result of greenhouse gasses! :)

upload_2018-6-28_13-27-49.png


upload_2018-6-28_13-28-10.png


upload_2018-6-28_13-28-33.png
 
The data does not conclusively show any such thing about water vapor. There is a good deal of uncertainty about water vapor feedbacks.

LOL, you're too funny.

IPCC
8.6.2.3 What Explains the Current Spread in Models’ Climate Sensitivity Estimates? (1.5 °C to 4.5°C - 2 x CO2).

In AOGCMs (Models), the positive water vapour feedback constitutes by far the strongest feedback (positive and negative).
Because the water vapour and temperature responses are tightly coupled in the troposphere (see Section 8.6.3.1), models with a larger (negative) lapse rate feedback also have a larger (positive) water vapour feedback.


So what is positive water vapour feedback?

It is the hypothesised increase in the greenhouse gas - water vapour, specifically in the tropical mid troposphere.

In models it is responsible for doubling, tripling, or even quadrupling the direct effect of increasing atmospheric CO2 (2 x CO2 = 1°C).

A consequence of an increase in mid tropospheric water vapour is an increase in temperature at that altitude, & the rate of this temperature increase is greater than the rate of warming in the troposphere below it, down to the surface. This is negative lapse rate feedback.


So if positive water vapour feedback is occurring it would clearly show up in the tropospheric temperature data. The upper troposphere will warm more than the lower troposphere. This is precisely what happens in global climate models.


Of course one can fairly argue that if the actual data shows the opposite, that is, the lower troposphere’s rate of warming to be greater than the mid troposphere, then water vapour feedback is negative, not positive. And this is exactly what the weather balloon (radiosonde) temperature data shows. No increase in mid troposphere water vapour, & less warming in the mid troposphere than below. This data is confirmed by both satellite data sets!


UAH satellite data, collected since 1978, shows that the rate of warming in the tropical Lower Troposphere is greater at 0.12 K/decade & only 0.08 K/decade in the tropical Mid Troposphere.
This is the oppisite of the hypothesis.

http://vortex.nsstc.uah.edu/data/msu/v6.0/tlt/uahncdc_lt_6.0.txt
http://vortex.nsstc.uah.edu/data/msu/v6.0/tmt/uahncdc_mt_6.0.txt
The UAH data is the work of the pioneers of satellite temperature data collection, Christy & Spencer, both PhD in Meteorology, & both received NASA’s Exceptional Scientific Achievement Medal for their global temperature monitoring work with satellites.


The other satellite data set, RSS, also collected since 1978, also shows that the rate of warming is not faster in the tropical mid troposphere than it in the lower tropical troposphere.
Again, this is the oppisite of the hypothesis.

Temperature trend Lower Troposphere (TLT) is 0.150K/decade
upload_2018-6-28_13-44-35.png


Temperature trend Mid Troposphere (TMT) is only 0.142K/decade
upload_2018-6-28_13-44-48.png

C:\Users\Steve\AppData\Local\Temp\msohtmlclip1\01\clip_image001.png


C:\Users\Steve\AppData\Local\Temp\msohtmlclip1\01\clip_image002.png


So, what’s this all mean?

The direct effect of doubling atmospheric CO2, from any concentration, is only 1°C (no feedback response, positive or negative).

The hypothesised positive water vapour feedback is responsible entirely for the hypothesised Net positive feedback, & the hypothesised Net positive feedback is responsible for the ridiculous computer model projections that give a range from 1.5°C to 4.5°C for a doubling of CO2. If water vapour feedback is not positive, and it’s obviously not going by the data, then Net feedback is negative, not positive, & this means that equilibrium climate sensitivity to a doubling of CO2 is less than the direct effect of a doubling of CO2 (1°C)!

:)
 
Last edited by a moderator:

This cartoon is a great representation of just how naive people are.

Research reveals:

· The climate impact of all Paris INDC promises is minuscule: if we measure the impact of every nation fulfilling every promise by 2030, the total temperature reduction will be 0.048°C (0.086°F) by 2100.

· Even if we assume that these promises would be extended for another 70 years, there is still little impact: if every nation fulfills every promise by 2030, and continues to fulfill these promises faithfully until the end of the century, and there is no ‘CO₂ leakage’ to non-committed nations, the entirety of the Paris promises will reduce temperature rises by just 0.17°C (0.306°F) by 2100.

Paris will be extraordinarily costly. It is likely this is the most expensive treaty in the history of the world.

Using the best individual and collectively peer-reviewed economic models, the total cost of Paris – through slower GDP growth from higher energy costs – will reach $1-2 trillion every year from 2030.

All that money for this -

upload_2018-6-28_14-23-51.png


According to the latest annual UN report on the "emissions gap," the Paris agreement will provide only a third of the cuts in greenhouse gas that environmentalists claim is needed to prevent catastrophic warming. If every country involved in those accords abides by their pledges between now and 2030 — which is a dubious proposition — temperatures will still rise by 3 degrees C by 2100. The goal of the Paris agreement was to keep the global temperature increase to under 2 degrees.

According to the UN’s own climate model, the difference between a world with all the promised Paris cuts and one without them is just 0.05C. Even if every nation including the US extended its carbon cut promises past 2030 and kept them going throughout the century, temperatures would drop by less than 0.2C.
 

IF YOU HAD TO TAKE A REEFING EXAM, WOULD YOU PASS?

  • Yes!

    Votes: 30 44.8%
  • Not yet, but I have one that I want to buy in mind!

    Votes: 9 13.4%
  • No.

    Votes: 25 37.3%
  • Other (please explain).

    Votes: 3 4.5%
Back
Top